Measured performance of Issuerd against Keycloak 26.7 under identical container
resource limits, plus CPU/RAM/disk/log sizing data. Issuerd is faster than
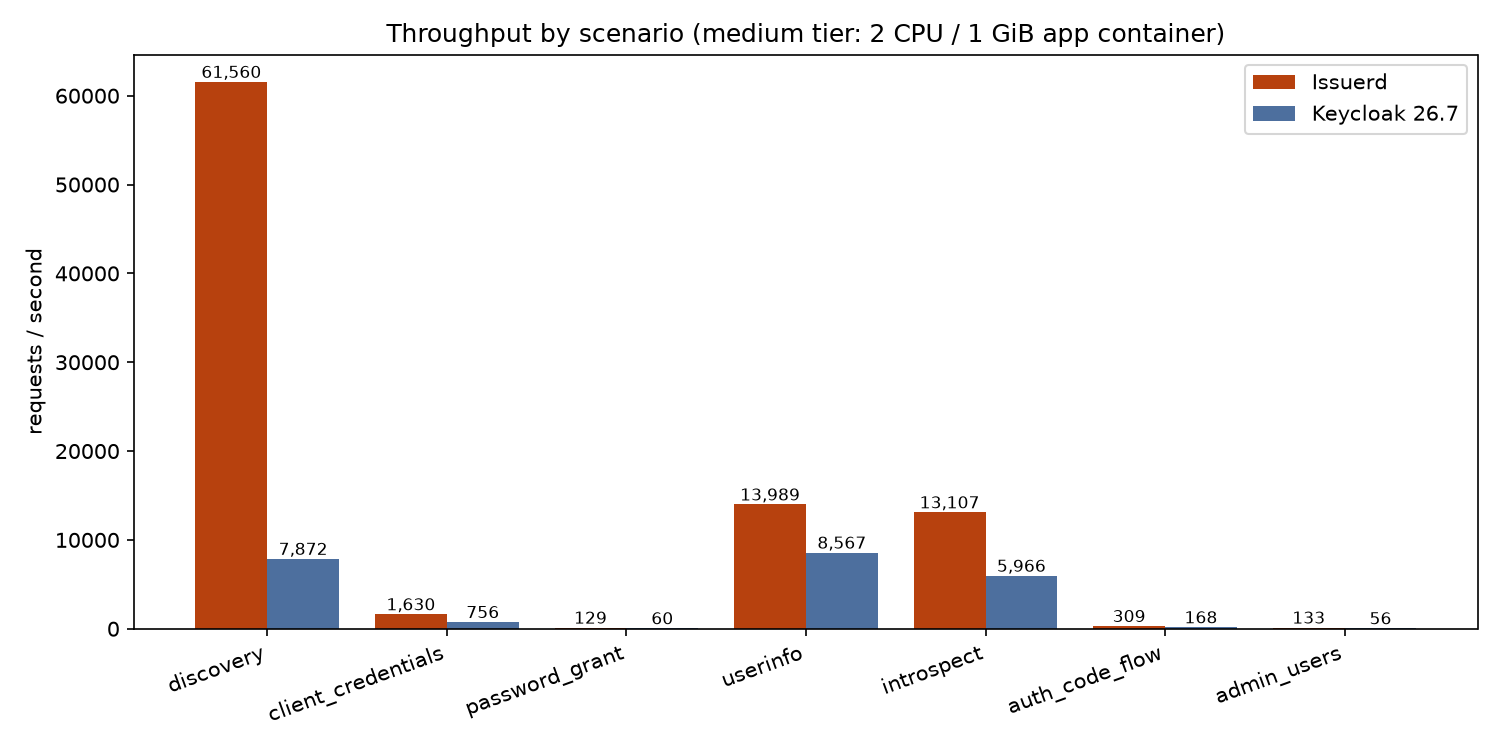
Keycloak 26.7 in every measured scenario — up to 7.8× the throughput, with lower
p99 latency in every headline scenario (§2; the agentic-workload nuances are in §4) —
while idling on ~6× less memory and shipping an 8.7× smaller image. Every number
on this page comes from a real run of the benchmark stack in tests/perf/ on the
hardware described below — nothing is estimated unless it is explicitly marked
(extrapolated).
Reproduce / re-measure: tests/perf/README.md (or ./scripts/campaign.sh for the
full ~1.5 h unattended run). Raw artifacts: tests/perf/results/<RUN_ID>/
(gitignored). Charts: python tests/perf/scripts/charts.py tests/perf/results/<RUN_ID>.
issuerd:perf — local release build from this repo (distroless image)
Keycloak
keycloak-optimized:26.7.4 — optimized production build of keycloak/keycloak:26.7.4 (kc.sh build at image-build time, start --optimized at runtime; tests/perf/keycloak/Dockerfile) + PostgreSQL 15 backend, realm import with 1,000 users
CIBA helper
ad-simulator (python:3.12-alpine, 0.25 CPU / 128 MiB) — approves Keycloak CIBA requests via KC’s auth-channel callback (§1.4)
Database (both)
postgres:15-alpine, one dedicated instance per server
Load generator
grafana/k6:2.1.0, running inside the isolated network (no host-network noise)
Topology: one Docker bridge network 172.34.0.0/24 with internal: true — no
internet access in either direction, nothing is published. Both servers serve plain
HTTP inside the network (TLS is normally terminated at the edge; both sides are
measured identically).
Same machine, same tiers, same k6 scripts, same scenario mix, runs executed
sequentially (the idle server adds no measurable load: <0.1% CPU).
Equal functional setup: realm perf, confidential + public clients, PKCE (S256) on
the auth-code flow, password users provisioned in bulk. Password hashing is each
server’s out-of-box default — Argon2id on both sides since Keycloak 25,
verified from the stored credential rows: Keycloak 26.7 Argon2id m=7,168 KiB,
t=5, p=1; Issuerd Argon2id m=19,456 KiB, t=2, p=1 (the Rust argon2 crate
default). Neither side was tuned.
Keycloak 26 persists user sessions in the database by default (the
persistent-user-sessions feature), so both servers now pay per-login DB writes.
Keycloak’s realm still has event persistence off (its default); Issuerd
persists login + admin events by default — Issuerd pays a per-login event write
that Keycloak skips.
Keycloak 26.7 runs its optimized production build — kc.sh build at
image-build time, start --optimized at runtime, the documented production
container shape (not the start-dev quickstart), with the public base URL
pinned via hostname v2 (--hostname=http://keycloak:8080).
DPoP is supported and on by default since Keycloak 26.4: KC binds a token
whenever a valid proof is presented, exactly like Issuerd. No client attribute
was set (forcing dpop.bound.access.tokens would break the proof-less
scenarios that share the same client).
CIBA (poll mode) is supported and on by default in Keycloak 26. KC’s
built-in HTTP auth channel is pointed at the ad-simulator container, which
approves every backchannel request through KC’s own callback endpoint. The k6
script waits a modeled 200 ms device-approval latency before its first
poll (polling earlier always loses the race against KC’s auth-session commit
and lands on the slow_down interval path); Issuerd’s approval is an
in-loop SSO-cookie call instead (§1.4). Both are disclosed in the numbers.
Introspection on Keycloak 25+ requires the calling client in the token’s
aud; the imported realm adds an audience-self protocol mapper to the
confidential client (no equivalent needed on Issuerd).
All reported runs had 0% scenario errors (k6 errors rate), except the
bulk-provisioning scenario where 409-conflict skips are by design (§3 note) and
one small-tier DPoP run with 0.6% transient transport failures (§4 note).
POST /token (ROPC), distinct user per request from a pool
20 VU, 60 s
userinfo
GET /userinfo with a Bearer token
100 VU, 60 s
introspect
POST /token/introspect (confidential client)
50 VU, 60 s
auth_code_flow
full browser-less login: GET /authorize → login POST → code+PKCE token exchange (3 requests)
15 VU, 60 s
dpop
two concurrent sub-scenarios (30 VU each): token request with a fresh ES256 DPoP proof, and DPoP-bound userinfo (proof carries ath, single-use jti)
2×30 VU, 60 s
ciba
full CIBA cycle: bc-auth → user approve → token poll. Issuerd: 3 measured requests, approval via SSO-cookie ext/ciba/approve. Keycloak: 2 measured requests, approval out-of-band via the ad-simulator after a modeled 200 ms device-approval latency
10 VU, 60 s
admin_users
Admin-API user creation with password (provisioning rate)
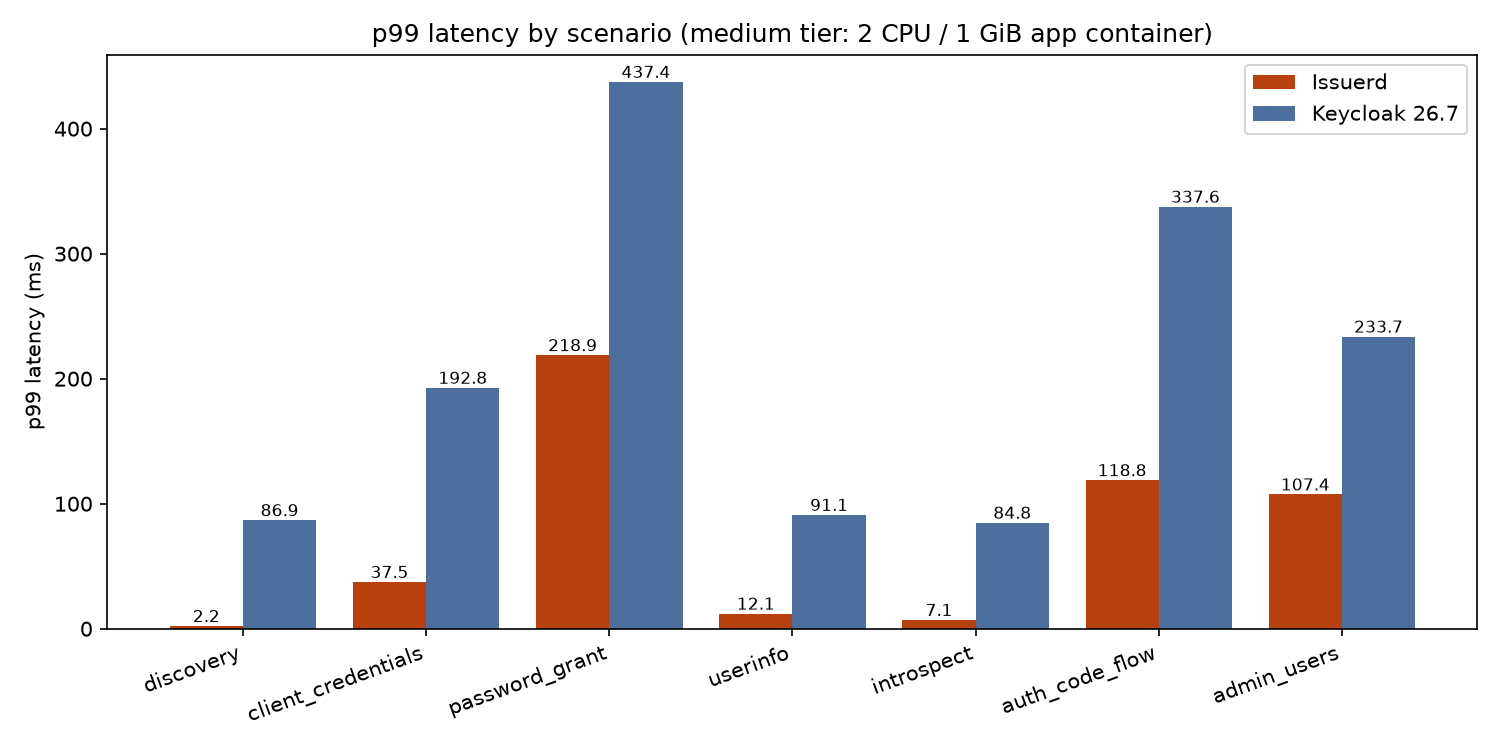
p99 latency (ms, lower is better — Issuerd is lower in every scenario):
Scenario
Issuerd p99
Keycloak 26.7 p99
discovery
2.2
86.9
client_credentials
37.5
192.8
password_grant
218.9
437.4
userinfo
12.1
91.1
introspect
7.1
84.8
auth_code_flow
118.8
337.6
admin_users
107.4
233.7
Reading the table honestly:
Both servers hash passwords with Argon2id by default (parameters in §1.3).
Single-VU latency probes: Issuerd 21.8 ms avg vs Keycloak 41.6 ms avg on
password_grant.
Logins and token issuance are CPU-bound on the password hasher / signer —
this is where Issuerd’s async architecture still wins outright: 2.2× the login
throughput with half the p99, and it keeps winning as CPU is added (§3).
Session-checked reads (userinfo/introspect): Issuerd wins both at every
tier. Medium tier: userinfo 13,989 vs 8,567 rps (1.6×), introspect
13,107 vs 5,966 rps (2.2×) — with p99 12.1 ms vs 91.1 ms and 7.1 ms vs 84.8 ms.
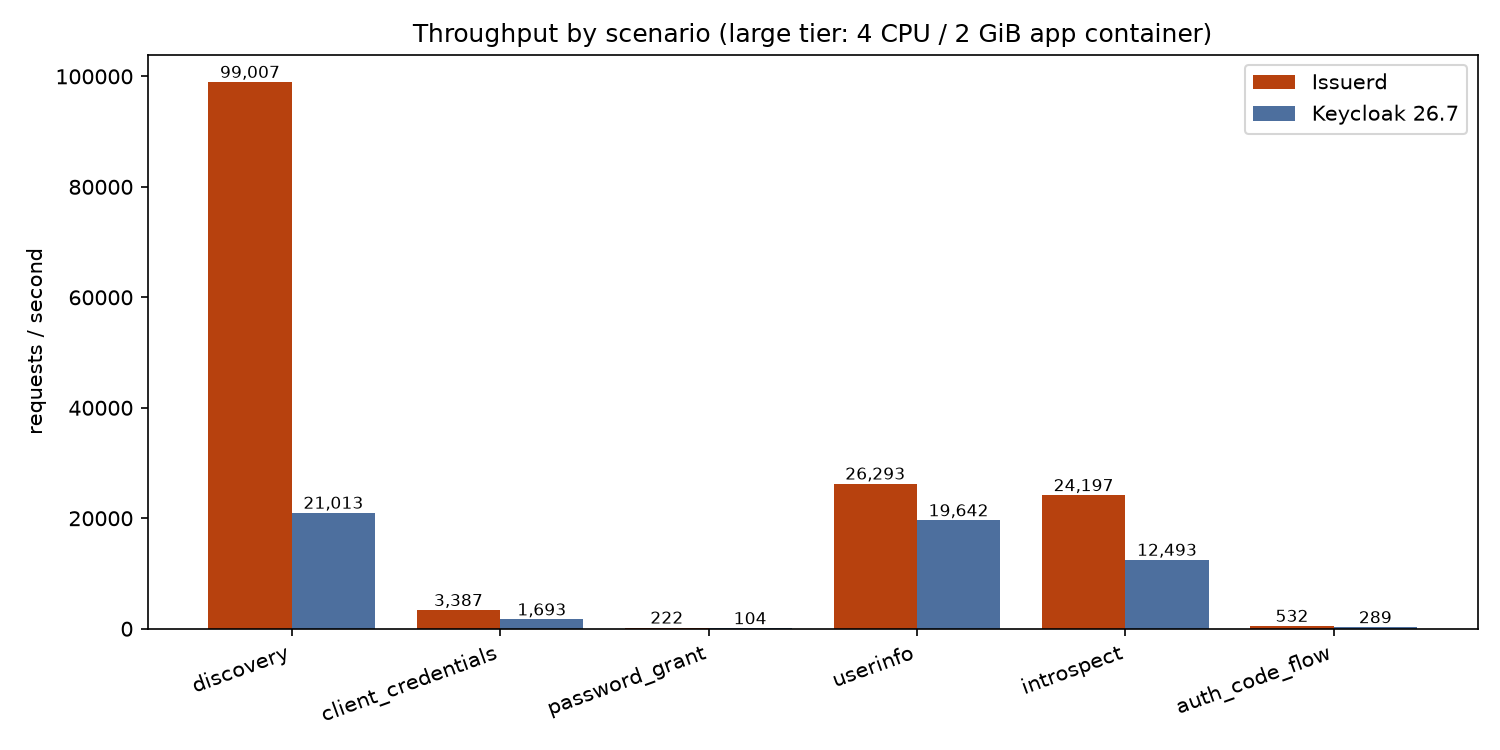
Large tier: userinfo 26,293 vs 19,642 rps, introspect 24,197 vs 12,493 rps.
Issuerd serves the whole read path from an Infinispan-style read model —
session validity, the user record, roles/groups, client and scope
configuration, and the fully rendered userinfo body are all cached with
synchronous, epoch/generation-validated invalidation — and its PostgreSQL
averages ~1% CPU under large-tier userinfo (1.1%), close to Keycloak’s
(0.3%). The design choice stands: revoke a session (or change a role) and it
takes effect immediately on every node, no invalidation-latency window.
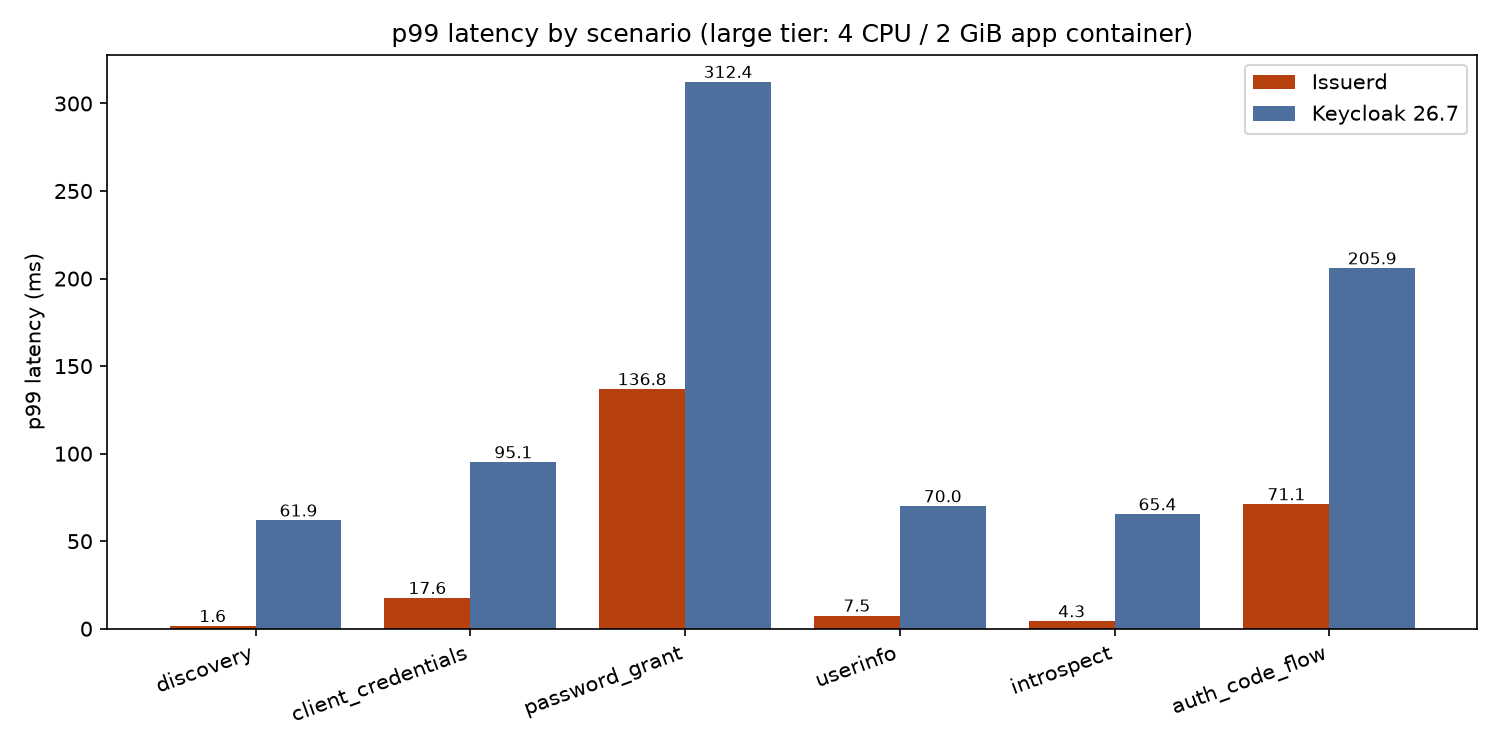
Keycloak’s medians on cached reads are excellent (p50 0.7–1.5 ms) but its tail
is not: at small/medium its p95 jumps to 79–99 ms, and even at the large tier
p99 stays 62–70 ms on paths whose p95 has dropped to ~3–5 ms — a GC-pause-shaped
tail. Issuerd’s p50→p99 spread stays tight (e.g. discovery 0.7 ms → 2.2 ms).
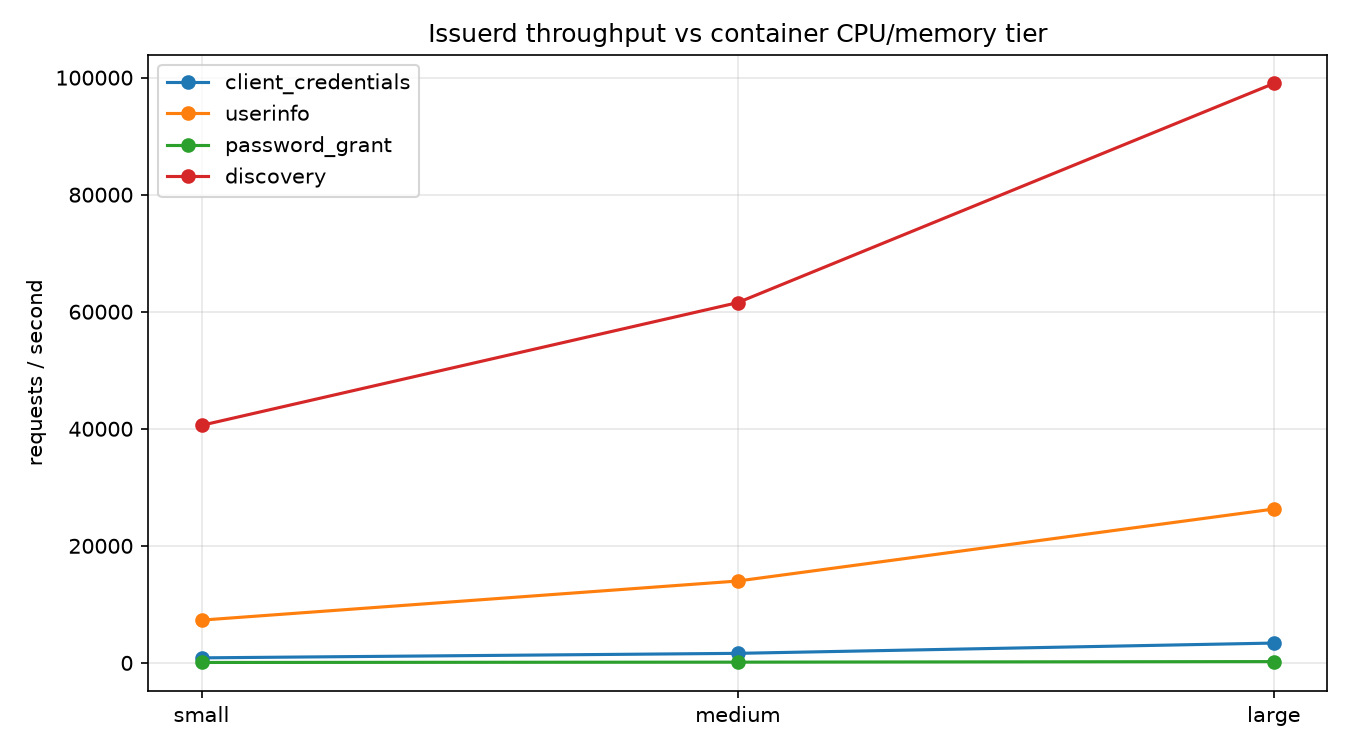
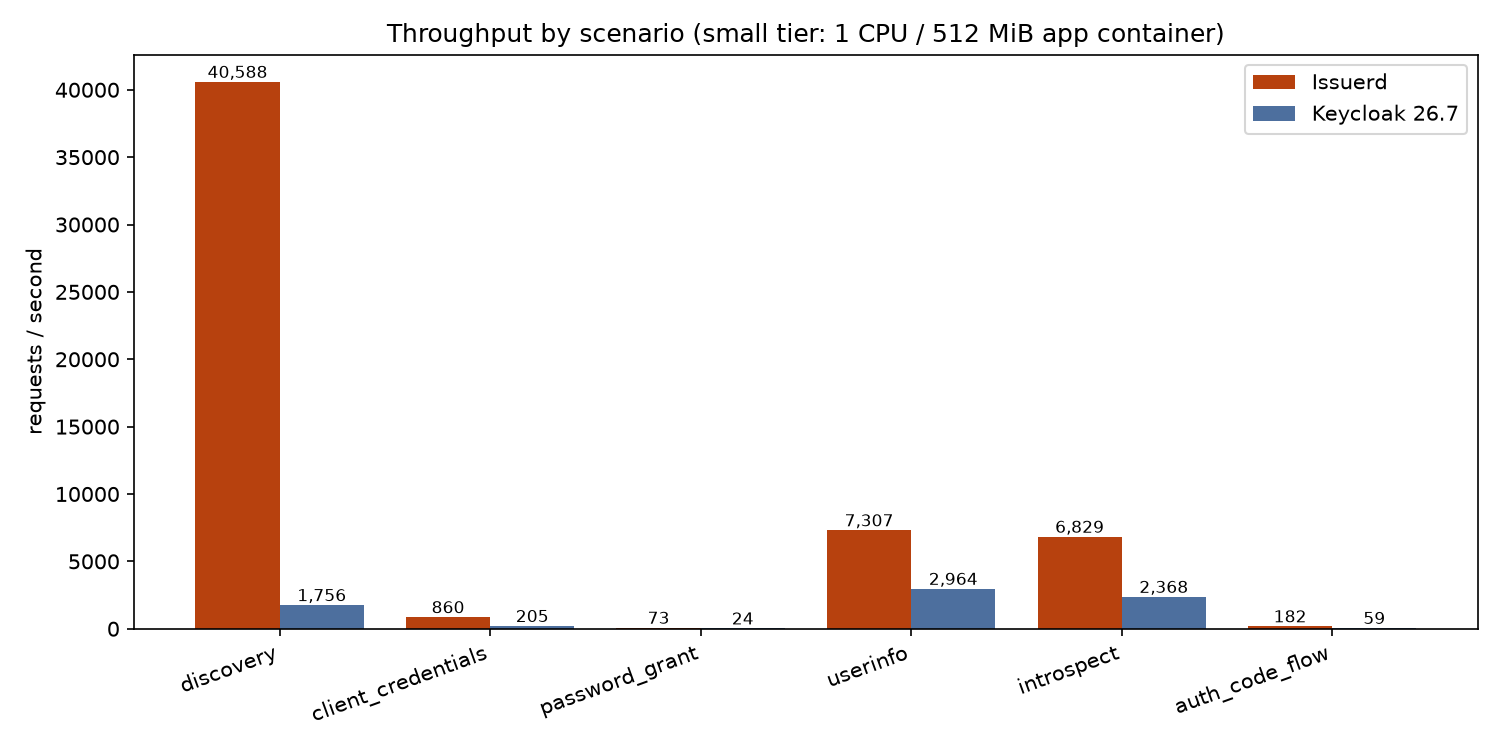
Issuerd scales almost linearly on CPU-bound paths: client_credentials
860 → 3,387 (3.9× for 4× the CPU), password_grant 73.5 → 222 (3.0×),
auth_code_flow 182 → 532 (2.9×).
userinfo and introspect scale near-linearly and win every tier
(userinfo 7,307 → 26,293, introspect 6,829 → 24,197 — ≈1.8–1.9× per CPU
doubling): app-CPU-bound (peak ≈410% of the 400% large-tier cap) with
PostgreSQL averaging ≈1%, beating Keycloak’s large-tier throughput 1.3×/1.9×
with far better tails (userinfo p99 7.5 ms vs 70.0 ms, introspect 4.3 ms vs
65.4 ms at the large tier).
discovery serves a pre-rendered, content-validated document and reaches
99,008 rps at the large tier (p99 1.6 ms) — 4.7× Keycloak’s 21,013, a
number Issuerd already exceeds at the small tier. Scaling flattens (2.4× for
4× CPU) because the fixed 50 k6 VUs, not the server, become the limit
(large-tier p50 is 0.4 ms).
Keycloak 26.7 scales well too — discovery 1,756 → 21,013, password_grant
24.3 → 104.1 — but starts lower everywhere.
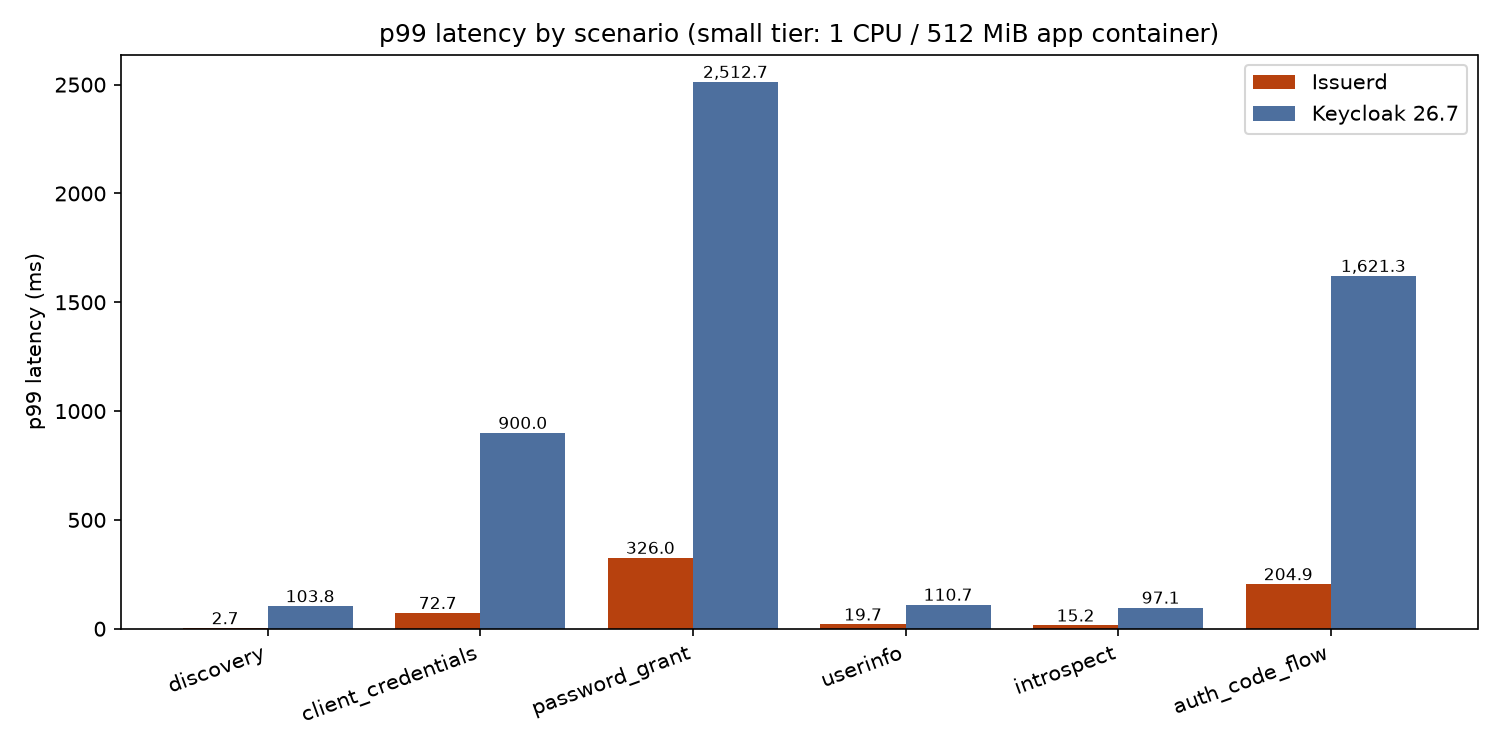
Keycloak boots and serves at the small tier (1 CPU / 512 MiB), but login p99 is
2.5 s and auth-code p99 is 1.6 s there; Issuerd’s worst small-tier p99 is
326 ms (password_grant, Argon2id on 1 CPU).
admin_users is compared at the medium tier only: the small/large runs reused
the deterministic user-name space on the same database, so most requests were
409-conflict skips rather than provisioning, and are excluded from the
comparison. The medium rows above ran against a fresh namespace for both
servers.
Issuerd implements DPoP (RFC 9449) and CIBA (poll mode) — the two flows
that matter most for agentic IAM (proof-of-possession tokens for tool/API calls,
and decoupled user approval for long-running agent actions). Keycloak 26.7
supports both (DPoP on by default since 26.4; CIBA poll mode via its HTTP auth
channel), so this section is a head-to-head.
Scenario
server
small
medium
large
p99 (medium)
dpop (proof-carrying requests/s)
Issuerd
2,094
4,262
7,649
74.9 ms
Keycloak
532
1,434
3,151
110.6 ms
ciba (full cycles/s)
Issuerd
188
285
446
24.5 ms
Keycloak
46.0
47.2
47.6
10.1 ms
DPoP: each iteration mints a fresh ES256 proof in k6 via WebCrypto; the
server verifies the signature, the single-use jti, and (on userinfo) the
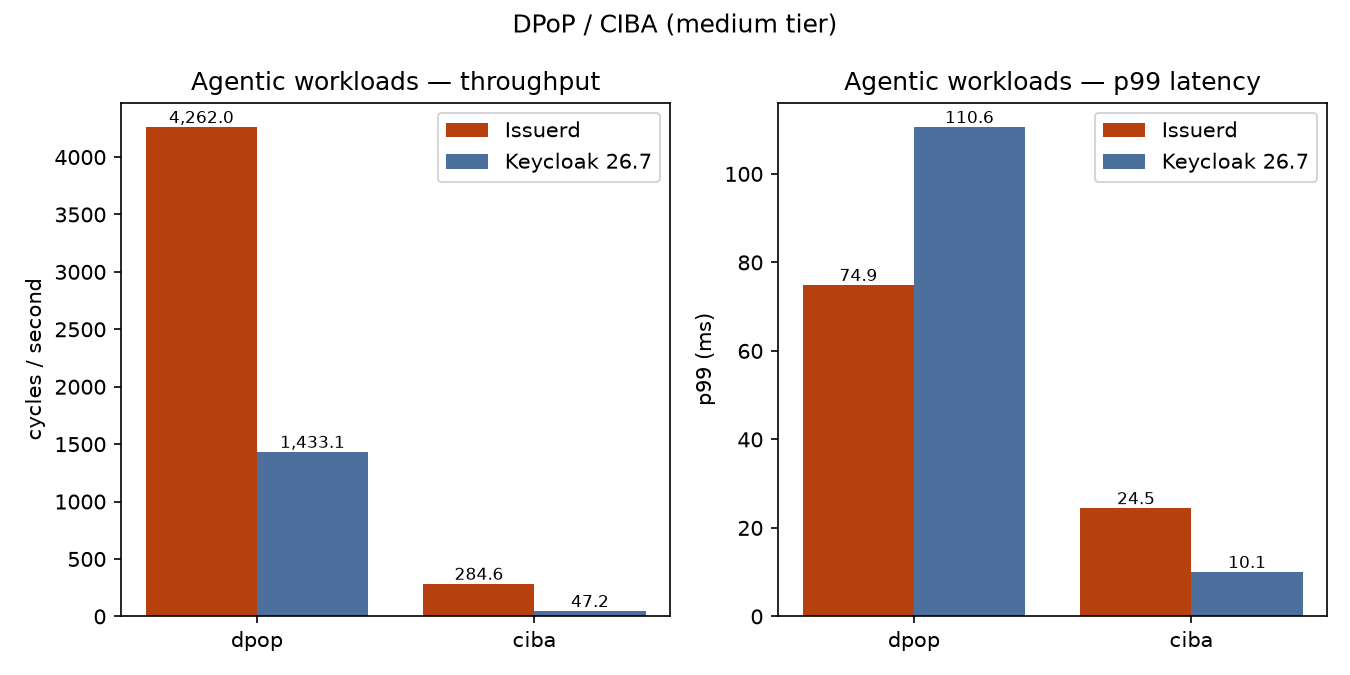
ath token binding. Issuerd leads 2.4–3.9× depending on tier — ES256
verification is pure CPU, and Issuerd’s lead tracks its general CPU
efficiency. Across the three tiers the campaign pushed 840k DPoP
proof-carrying requests through Issuerd and 307k through Keycloak.
CIBA: the cycle shapes differ by design (§1.4): Issuerd’s cycle is three
measured requests (bc-auth → SSO-cookie approve → poll), Keycloak’s is two
(bc-auth → poll) with the approval performed out-of-band by the ad-simulator
container and a modeled 200 ms device-approval latency before the first poll.
Two honest ways to read it:
Cycle rate at 10 VUs: Issuerd completes 285 cycles/s at the medium
tier and scales with CPU (188 → 446); Keycloak sits flat at ≈47 cycles/s
at every tier — bounded by the harness (10 VUs × 200 ms modeled latency ≈
50 cycles/s ceiling), not by server capacity: Keycloak’s app CPU averaged
only 29–36% of one core during CIBA, so its real ceiling is far above what
this harness can express.
Per-request latency: both servers are excellent — Keycloak’s p99 is
10.1 ms vs Issuerd’s 24.5 ms at the medium tier. Note Issuerd’s measured
requests include the approval write path itself (browser-session
authentication + approval + audit event), which the Keycloak numbers
delegate to the helper container.
Load on the database: Issuerd’s CIBA is its heaviest DB workload —
PostgreSQL averaged ~55% of one core at the medium tier and ~99% of one core
(of its 2-core allowance) at the large tier, without saturating.
Across the campaign Issuerd completed 46.6k full CIBA cycles and Keycloak
8.5k, all with 0 errors. The one blemish anywhere in the campaign:
Issuerd’s small-tier DPoP run recorded 0.61% transient transport failures
(769 of 125,718 requests; the scenario-level errors rate stayed 0) — a
one-off at the 1-CPU tier, not a systematic limit.
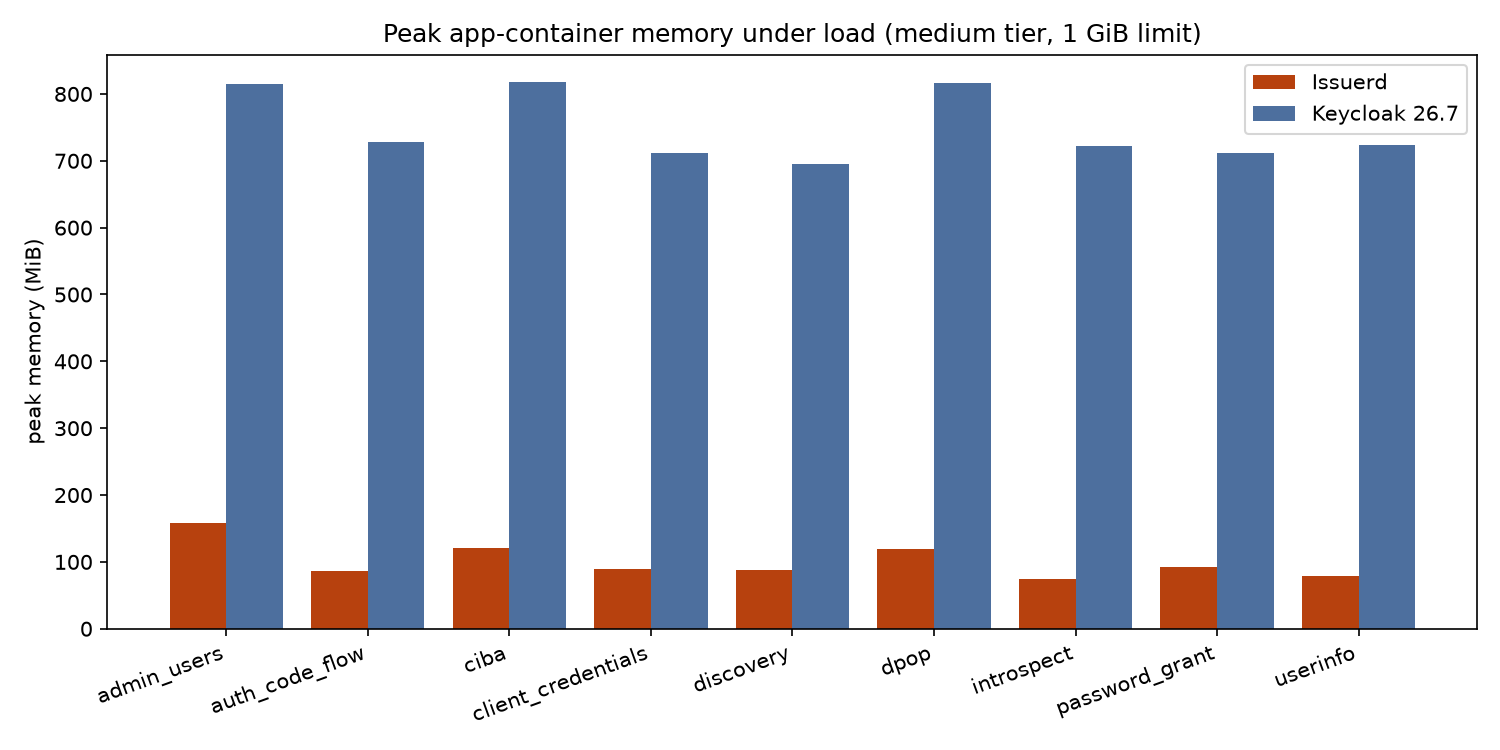
Memory. Issuerd’s working set is an order of magnitude smaller and flat across
scenarios — no GC, no heap to tune:
idle RSS
peak under load (medium tier)
Issuerd app
88 MiB
74–158 MiB across all 9 scenarios
Keycloak 26.7 app
533 MiB
696–818 MiB
At the large tier the worst peaks were 271 MiB (Issuerd, bulk provisioning) vs
1,255 MiB (Keycloak, auth_code_flow) against a 2 GiB limit.
CPU. Under load both servers saturate their container CPU cap on CPU-bound
scenarios (Issuerd averages 175–191% and peaks ≈190–205% of its 200% medium cap
on discovery, userinfo and introspect; Keycloak peaks ≈200–210%). CIBA is the
only scenario that saturates neither (§4). No measured read path is DB-bound:
Issuerd’s PostgreSQL averages ≤1.2% CPU under discovery, userinfo and
introspect at every tier (Keycloak’s: ≤0.5%), and remaining DB work is on the
write paths — logins, CIBA cycles and provisioning.
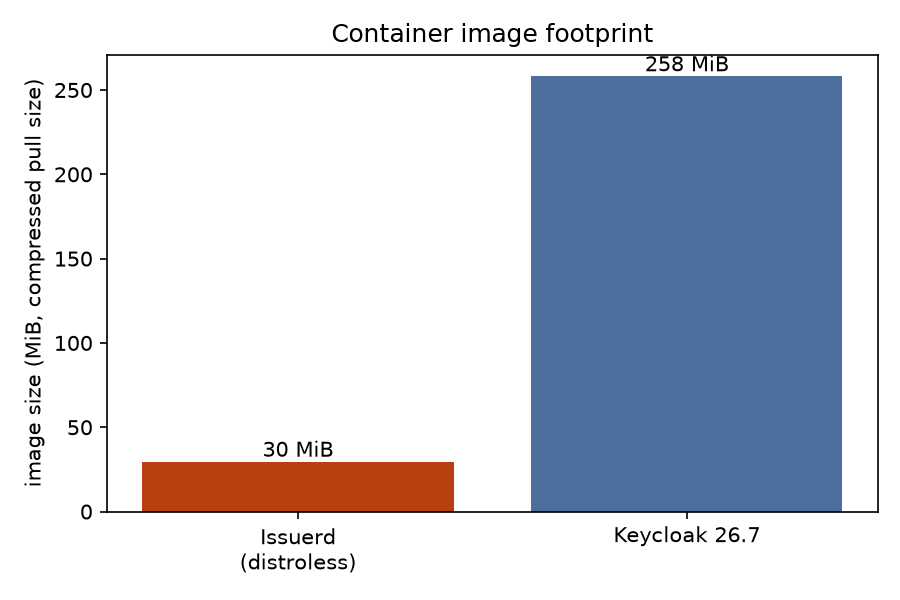
Image footprint. 29.5 MiB vs 258.1 MiB compressed — the content size a
docker pull transfers (docker image inspect.Size under Docker Desktop’s
containerd image store) — 8.7× smaller. Uncompressed on disk it is 119 MB vs
762 MB (6.4×); of that, the stripped Issuerd release binary itself is ~52 MB
and the rest is the distroless base plus the krb5 shared libs (the Keycloak
figure is the optimized production image — the base image plus its persisted
build state). Either way: faster pulls, faster cold starts and a smaller CVE
surface (distroless: no shell, no package manager).
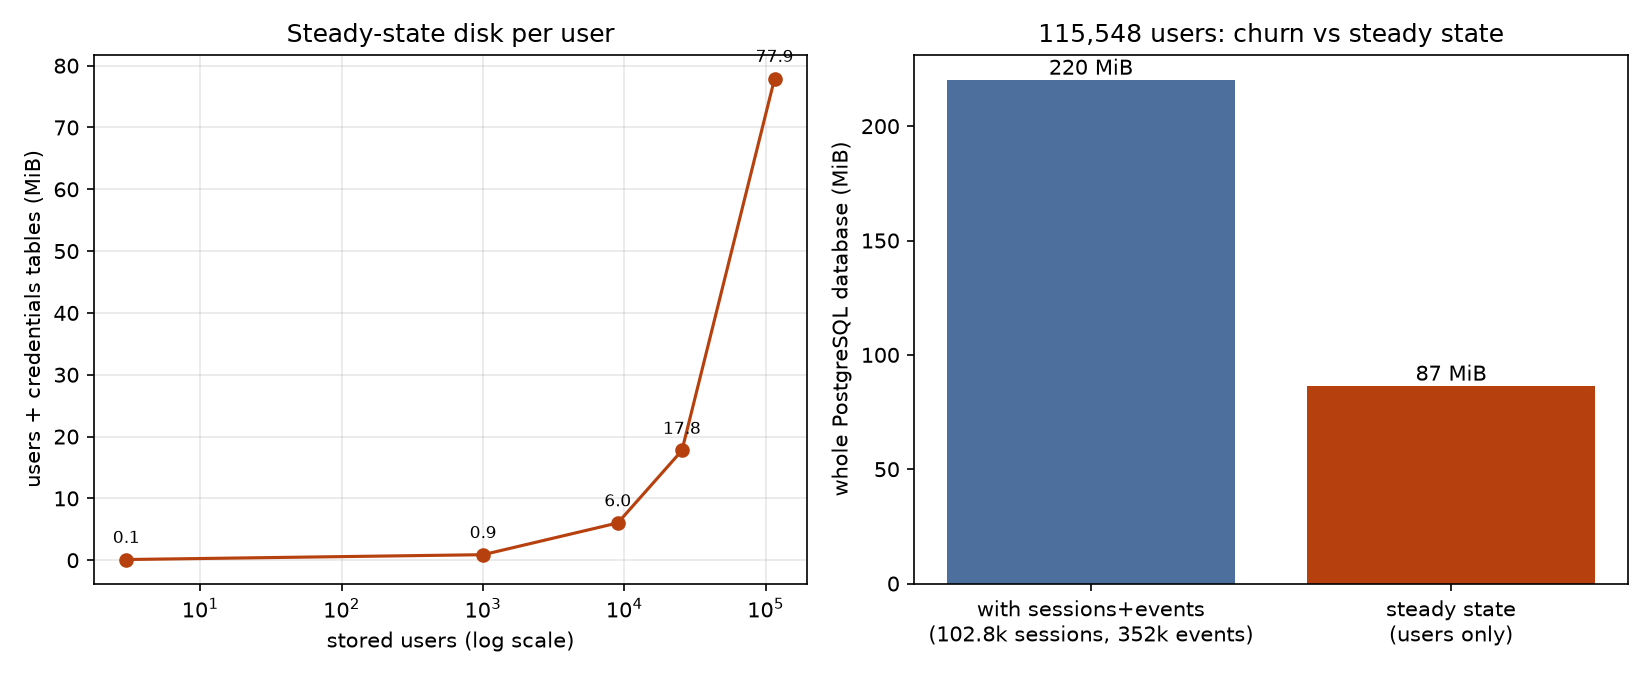
Measured on the campaign’s seeding ladder (3 → 1,003 → 25,548 → 115,548 users;
users + credentials table heap):
Marginal cost per stored user: ≈702 B (slope between the 1k and 115.5k
points; includes the Argon2id password credential). PostgreSQL page
granularity makes small populations look step-wise.
Whole database at 115,548 users, steady state (sessions/events wiped):
86.5 MiB total (all tables + indexes), i.e. well under 1 GiB for a
hundred-thousand-user directory. (Extrapolated: 1 M users ≈ 0.7 GiB for
users+credentials, ≈0.8 GiB whole DB — projection, not measured.)
The same database before wiping transient rows (102.8k live sessions,
~352k stored events incl. admin events): 220.3 MiB — i.e. login churn can
exceed user data if events/sessions are never expired. Set
events_expiration_secs per realm and rely on session expiry; dead tuples are
reclaimed by autovacuum in normal operation.
Reference: the Keycloak 26.7 database measured 15.9 MB after import (realm +
1,000 users) and 80.9 MB after its three matrices (≈5.5 M requests, ≈30k
logins). Keycloak 26 persists user sessions in the database by default, so its
database grows per login too — event persistence is still off in this setup
(§1.3).
6.2 Per-login and per-CIBA-cycle churn (Issuerd, measured)
Issuerd logs every request span plus one INFO event per login/token issue.
Measured via docker logs byte deltas around dedicated 30–60 s bursts:
Traffic
Log bytes / request
discovery
≈0.49 KB
client_credentials
≈1.7 KB
CIBA
≈1.2 KB
password_grant (login)
≈1.75 KB
Rule of thumb: log bytes/day ≈ rps × bytes-per-request × 86,400. Example: 100
logins/s ≈ 15 GB/day at INFO (arithmetic projection from the measured
per-request rate). For high-volume deployments run the app at WARN and/or ship
JSON logs to a collector with rotation. Keycloak writes almost nothing per
request by default (1.7 MB total after its whole 9-scenario medium matrix of
≈1.5 M requests — ≈1.2 B/request), so this line item is Issuerd-specific — the
trade-off for always-on audit detail.
Seeded to 115,548 users through the public Admin API (which also measures bulk
provisioning): 157 users/s sustained for 10.6 minutes (100,000 users, each with
an Argon2id password — the hasher, not the insert, is the bottleneck; 10% of
requests were idempotent 409-skips by design). Against that database:
password_grant over a 100,000 distinct-user pool (no repeats): 128.5
logins/s, p99 218.9 ms, 0 errors (a corroborating 120 s/40-VU run logged
15,200 logins at 126.4 logins/s, p99 394.5 ms, 0 errors — session count
verified in the DB snapshot). The same scenario on the 1k-user database ran
131.9 logins/s, p99 215.6 ms — user count does not measurably affect the
token path.
auth_code_flow at 100k users: 103 full logins/s (309 req/s), p99
118.8 ms, 0 errors.
The medium-tier headline rows for discovery, client_credentials, ciba,
password_grant and auth_code_flow (§2) were measured against this
115,548-user database (the Keycloak rows against its 1,000-user import —
the 100k seeding ladder is Issuerd-only because it doubles as the
provisioning-rate measurement).
RAM headroom is generous: at the medium tier the app peaked at 158 MiB (bulk
provisioning; ≤121 MiB on every other scenario), and even at the large tier the
worst peak was 271 MiB against the 2 GiB limit — the 512 MiB small-tier limit is
mostly margin. Disk: §6.4. Multi-node horizontal scaling (shared PostgreSQL +
Redis, signing keys in storage) is covered in CLUSTERING.md.
The numbers above are end-to-end (k6 → Docker → Issuerd → PostgreSQL). The repo also
ships in-process benchmarks (in-process Axum harness, single core, no Docker) used for
regression gating:
Terminal window
cargotest--testintegration----ignored--nocapture
Metric
Target
Notes
Token issuance (password grant)
< 2 ms p99
RS256 signing + storage write
Token validation (stateless JWT)
< 0.5 ms p99
JWKS lookup + signature verify
Auth code flow (password)
< 50 ms p99
Full redirect + login + code exchange
Throughput (token validation)
> 1000 req/s per core
UserInfo endpoint
Throughput (token issuance)
> 500 req/s per core
Password grant
Benchmarks are marked #[ignore = "benchmark"] so they do not run in normal CI.
Results are printed to stdout and should be captured by the CI runner for trend analysis.